This is the first post of a series of articles about multi-tenant metrics with Prometheus Agent; here you will read how to enable Prometheus Agent mode and how to ingest metrics to a central Prometheus instance but also the limitations of this setup.
Let’s say you’re managing 5 - 10 to n Kubernetes clusters (or hopefully Vclusters) for your tenants and you want to provide metrics to the developers: cpu usage, memory usage, custom metrics etc. I bet one of your first choice would be Prometheus, the de facto standard for Kubernetes cluster monitoring. If you want an out of the box solution you can try kube-prometheus which installs everything you need to monitor a cluster. But given the number of clusters you have, it means you’re going to manage N kube-prometheus installations, which adds complexity and increases your TCO so you would like a lightweight solution which gets these data and move it to a central location for further aggregation / analysis or, maybe your clusters are very small and with few resources (Edge clusters for example) hence you’re forced to move your observability outside your clusters.
What you want now is Global View over these metrics.
With Prometheus you have three ways to achieve the above:
- Federation: basically with this solution you have a central Prometheus instance which scrapes metrics (or subset of metrics) exposed by the “leaf” Prometheus instances.
- Remote Read: usually you can achive this by having a central Thanos instance which reads from other Prometheus instances which in turn are exposed by a Thanos sidecard.
- Remote Write: it allows to forward all metrics (or a subset of them) to a remote location using the Remote Write API. So you will end up by having a central prometheus instance (global instance) which receives data from the other instances. With Remote Write we can stream metrics and store them to a central location and offload as much work from our tenant clusters.
Given the requirements above, the remote write solutions seems the best choice since we’re going to end up by having a (mostly) stateless solution: data will be removed once it has been flushed to the remote prometheus instance. This solution is also suitable when you have strict security requirements since we’re not opening ports on the prometheus instances but just on the central prometheus location.
Introducing Prometheus Agent
Prometheus has a new feature called “Agent” which allows Prometheus to run without the query, alert and storage components: a lightweight instance which just scrapes your targets by using ServiceMonitor/PodMonitor (since everything else stays the same) and forward these metrics to a remote Prometheus instance (or Prometheus compatible endpoint). Moreover, with the Agent mode, Promethues can scale horizontally! In fact, with this mode, the internal storage will be switched to a customized TSDB WAL which will retain data that cannot be pushed to the remote location (because of network issues for example) and removed it as soon the connectivity will be reestablished.
In order to deploy Prometheus Agent in our Kubernetes cluster(s) we can leverage prometheus-operator bundle to test it out.
To enable the Agent mode, we need to override the args passed to Prometheus in this way:
apiVersion: monitoring.coreos.com/v1
kind: Prometheus
metadata:
  labels:
    app.kubernetes.io/component: prometheus
    app.kubernetes.io/instance: prometheus
    app.kubernetes.io/name: prometheus
    app.kubernetes.io/part-of: kube-prometheus
    app.kubernetes.io/version: 2.36.1
  name: prometheus
  namespace: monitoring
spec:
  enableFeatures: []
  image: quay.io/prometheus/prometheus:v2.36.1
  containers:
  - name: prometheus
    args:
    - '--config.file=/etc/prometheus/config_out/prometheus.env.yaml'
    - '--storage.agent.path=/prometheus'
    - '--enable-feature=agent' # this feature flag
    - '--web.enable-lifecycle'
    securityContext:
      allowPrivilegeEscalation: false
      capabilities:
        drop:
          - all
  podMetadata:
    labels:
      app.kubernetes.io/component: prometheus
      app.kubernetes.io/instance: k8s
      app.kubernetes.io/name: prometheus
      app.kubernetes.io/part-of: kube-prometheus
      app.kubernetes.io/version: 2.36.1
  podMonitorNamespaceSelector: {}
  podMonitorSelector: {}
  probeNamespaceSelector: {}
  probeSelector: {}
  replicas: 1
  resources:
    requests:
      memory: 400Mi
  securityContext:
    fsGroup: 2000
    runAsNonRoot: true
    runAsUser: 1000
  serviceAccountName: prometheus
  serviceMonitorNamespaceSelector: {}
  serviceMonitorSelector: {}
  version: 2.36.1
  remoteWrite:
  - url: "https://my-central-observability-cluster.domain.com/prometheus/api/v1/write"
  replicaExternalLabelName: "__replica__"
  externalLabels:
    tenant: "tenant_name"
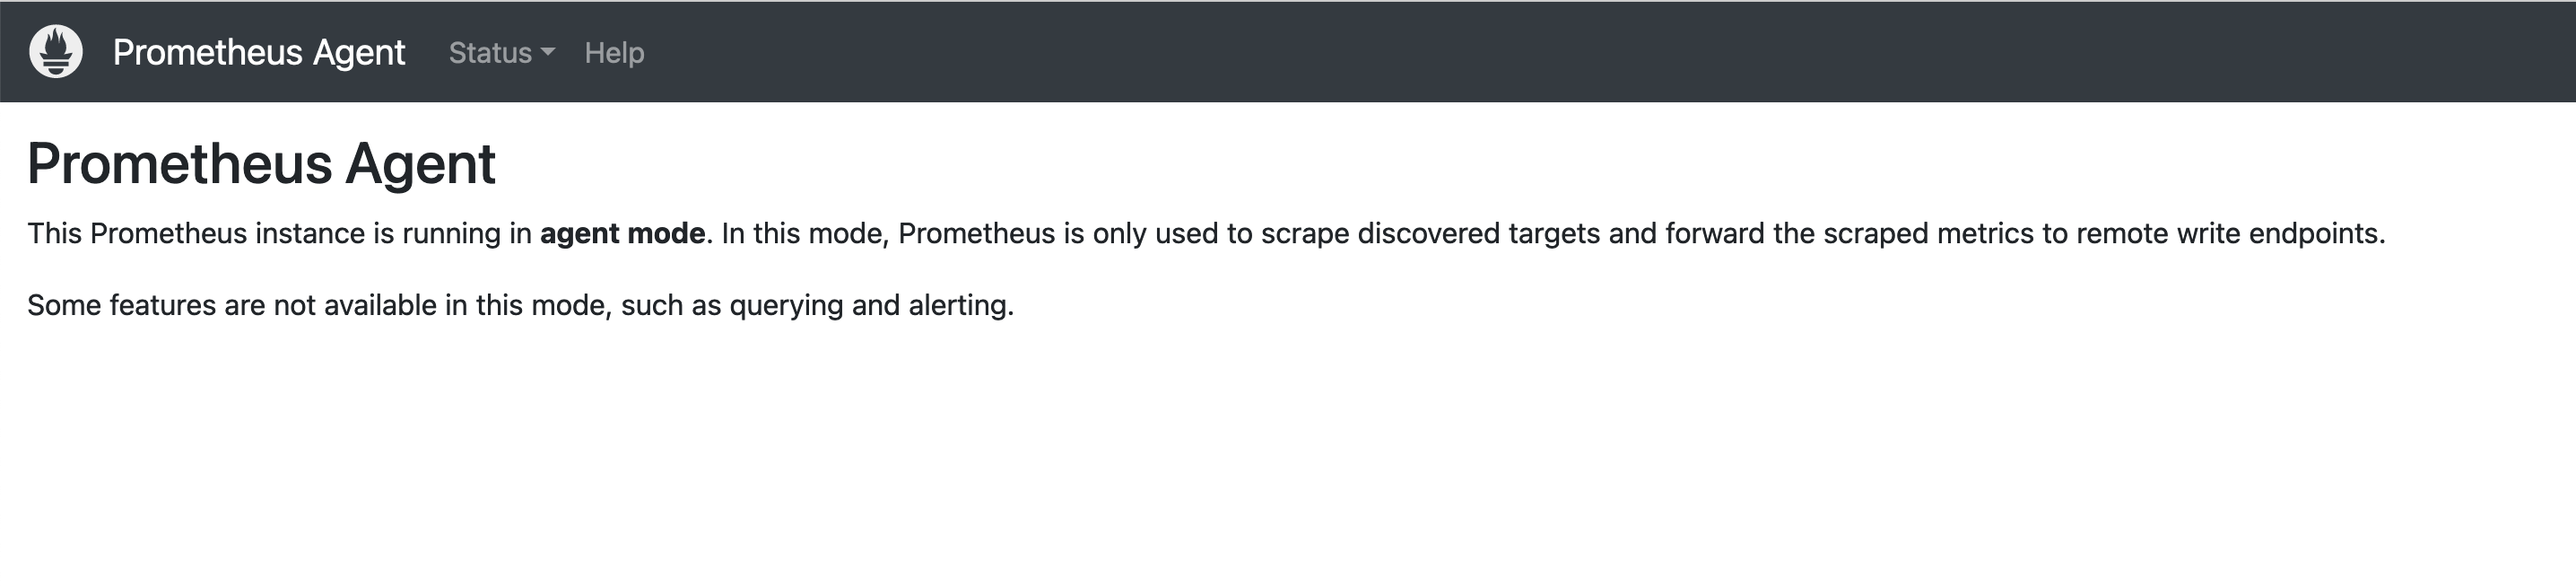
As you can see we can enable the agent mode by specificing the feature flag –enable-feature=agent . Also, the last 4 lines are very important: we’re telling to the Agent to send metrics to https://my-central-observability-cluster.domain.com/prometheusapi/v1/write and the external_labels section which will attach the specified label to each metric so we can differenciate between each tenant when aggregating in the central Prometheus installation.
You can apply the file above and by issuing kubectl port-forward svc/prometheus 9090 -n monitoring you will see that Prometheus is in Agent mode.
Once we have Promethues Agent up and running we need to think about the central cluster in which we will send these metrics; we want to achieve something like this:

In the central Prometheus instance, you want to enable the remote-write-receiver feature which allows to accept remote write requests from other Prometheus instances.
apiVersion: monitoring.coreos.com/v1
kind: Prometheus
metadata:
  labels:
    app.kubernetes.io/component: prometheus
    app.kubernetes.io/instance: k8s
    app.kubernetes.io/name: prometheus
    app.kubernetes.io/part-of: kube-prometheus
    app.kubernetes.io/version: 2.36.1
  name: k8s
  namespace: monitoring
spec:
  alerting:
    alertmanagers:
    - apiVersion: v2
      name: alertmanager-main
      namespace: monitoring
      port: web
  enableFeatures: ['remote-write-receiver'] # enable this feature
  externalLabels: {}
  image: quay.io/prometheus/prometheus:v2.36.1
  podMetadata:
    labels:
      app.kubernetes.io/component: prometheus
      app.kubernetes.io/instance: k8s
      app.kubernetes.io/name: prometheus
      app.kubernetes.io/part-of: kube-prometheus
      app.kubernetes.io/version: 2.36.1
  podMonitorNamespaceSelector: {}
  podMonitorSelector: {}
  probeNamespaceSelector: {}
  probeSelector: {}
  replicas: 2
  resources:
    requests:
      memory: 400Mi
  ruleNamespaceSelector: {}
  ruleSelector: {}
  securityContext:
    fsGroup: 2000
    runAsNonRoot: true
    runAsUser: 1000
  serviceAccountName: prometheus-k8s
  serviceMonitorNamespaceSelector: {}
  serviceMonitorSelector: {}
  version: 2.36.1
Then you can expose this Prometheus with an ingress like this:
apiVersion: networking.k8s.io/v1
kind: Ingress
metadata:
  annotations:
    kubernetes.io/ingress.class: "nginx"
    nginx.ingress.kubernetes.io/rewrite-target: /$2
  name: prometheus-remote
  namespace: monitoring
spec:
  tls:
  - hosts:
    - my-central-observability-cluster
    secretName: my-secret
  rules:
  - host: my-central-observability-cluster.domain.com
    http:
      paths:
      - backend:
          service:
            name: prometheus-k8s
            port:
              number: 9090
        path: /prometheus(/|$)(.*)
        pathType: ImplementationSpecific
If you navigate grafana then, you can test if you’re receiving the remote metrics by just querying for:
up{tenant=“tenant_name”}
you should see a bunch of metrics.
Multi-tenant metrics with Grafana
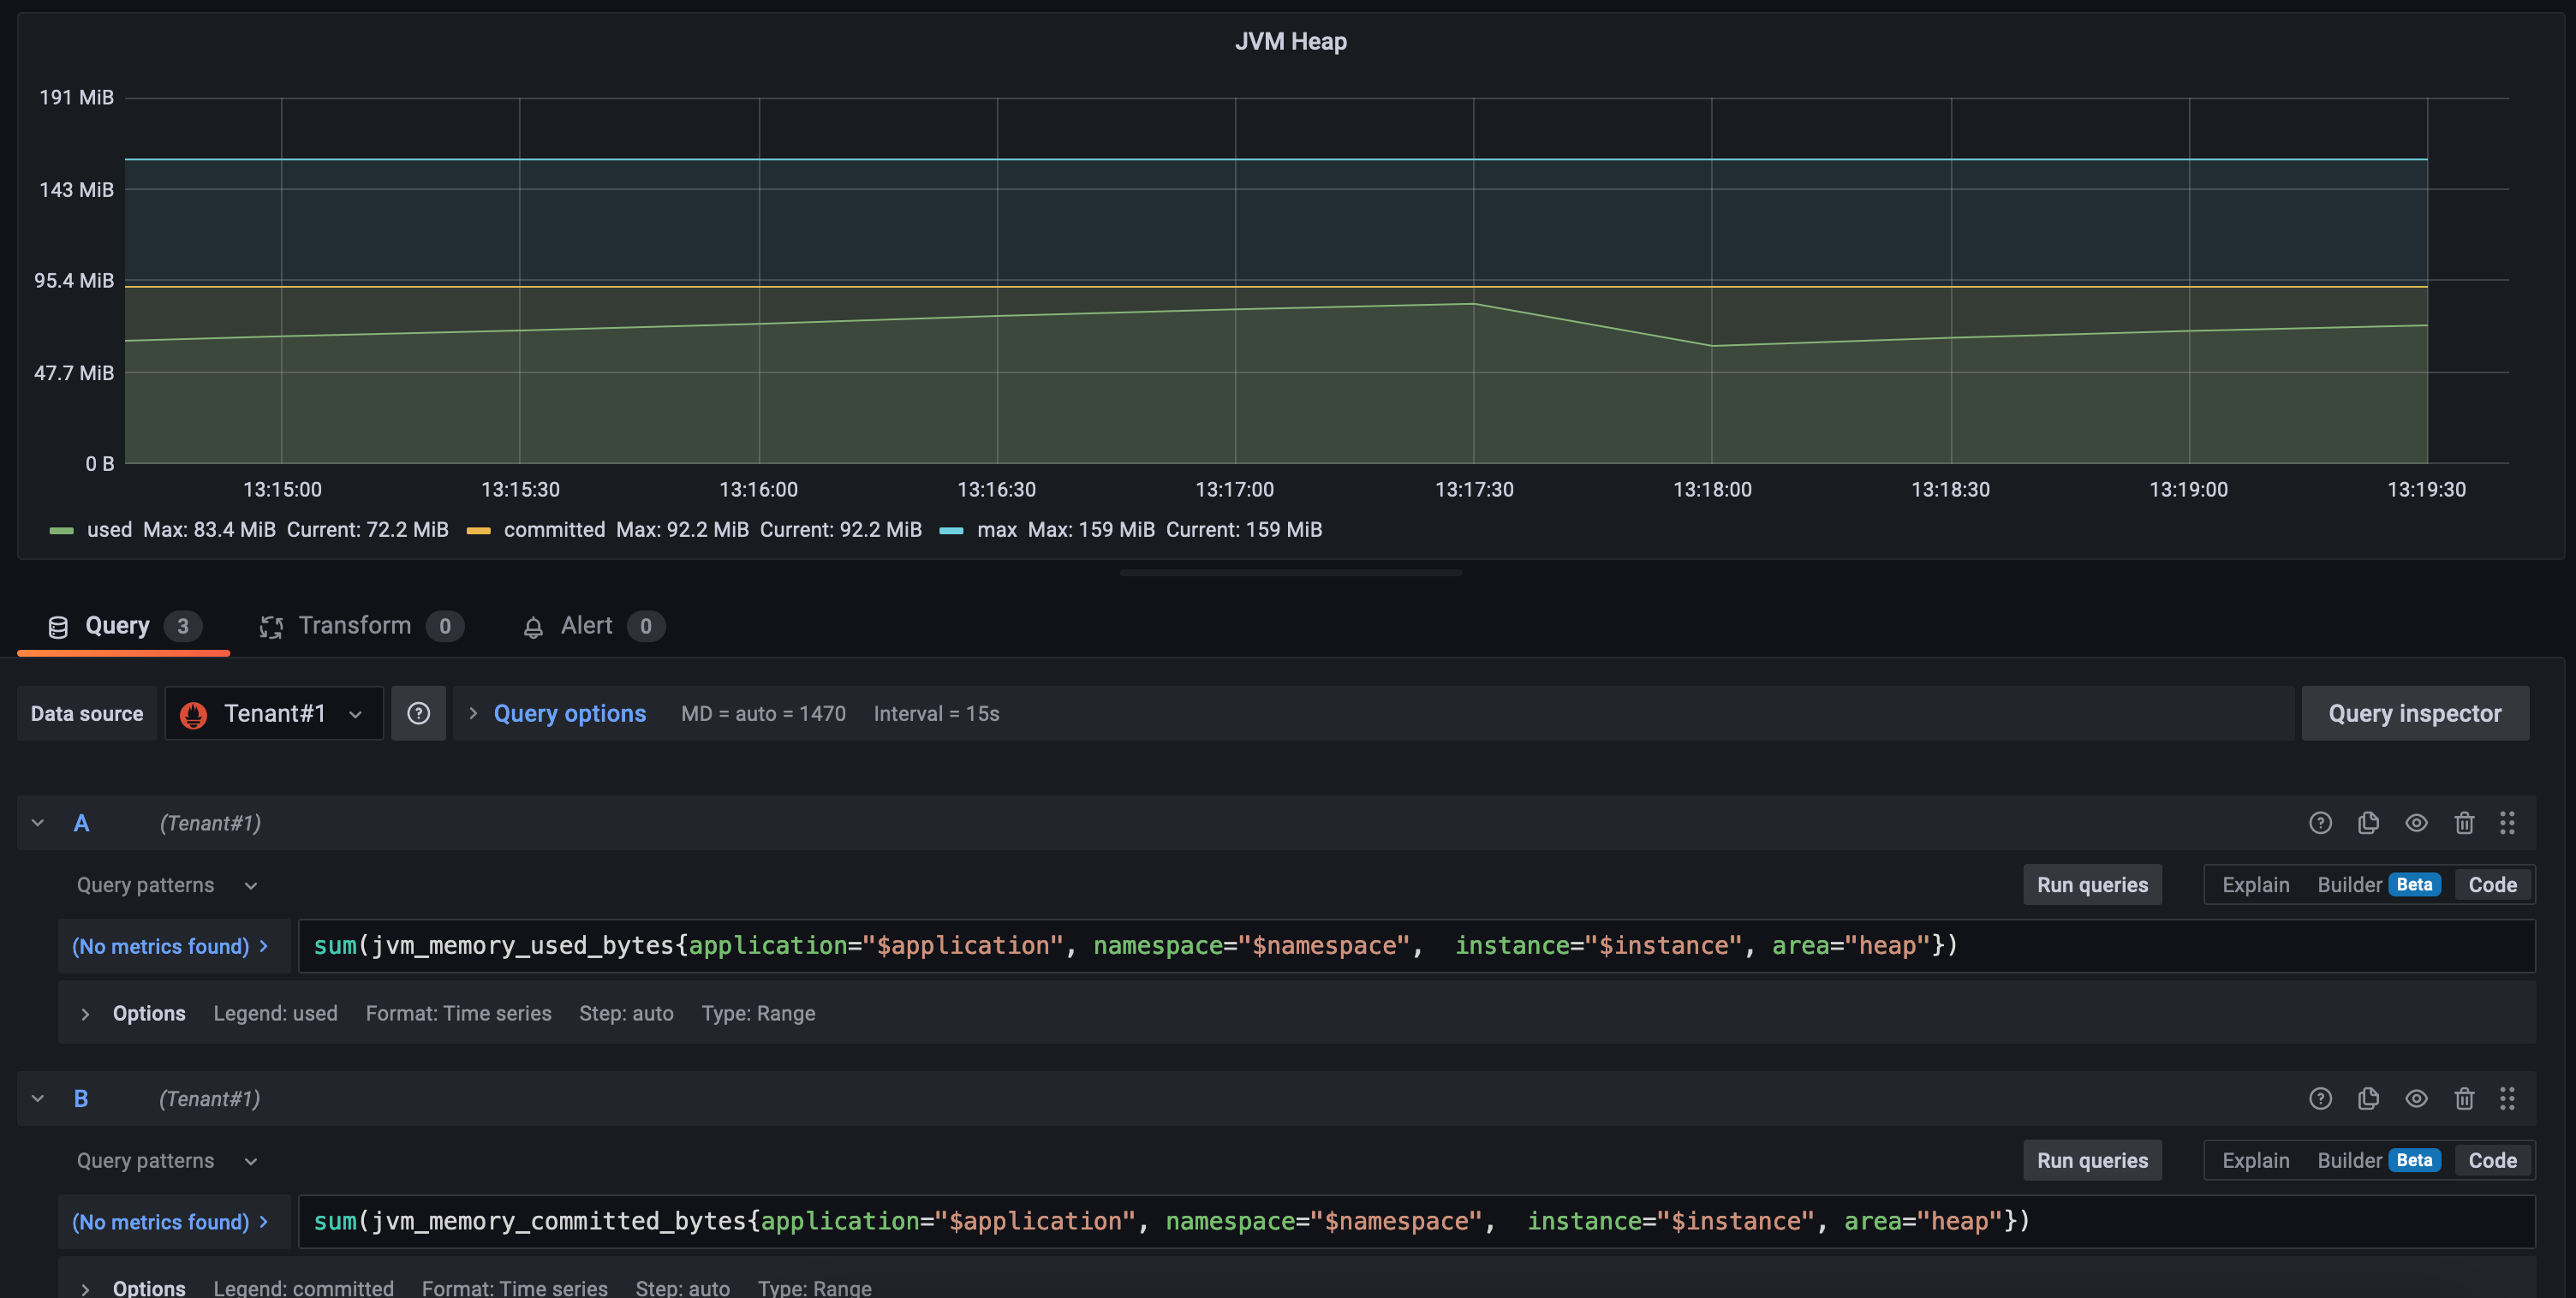
Then how to provide these metrics to the various tenants with Grafana? With the above solution we need to edit our dashboards and add a new variable to each query. For example, let’s take this dashboard JVM Micrometer, you want to edit it by adding a new variable:

and then use this variable in each query, for example:
resets(process_uptime_seconds{application="$application", namespace="$namespace", tenant="$tenant", instance="$instance"}[1m]) > 0"
But keep in mind that this way our tenants can check metrics from other tenants by just using the dropdown menu! So another solution would be to provision a set of dashboards for each tenant with the pre-defined tenant variable and assign these dashboards to differents Grafana Organization and then map each user to a specific organization.
So as you can see this solution comes with its limitations as you can’t properly isolate these metrics from each tenant. Moreover, we still incur in the scalability issues Prometheus has: if we don’t plan to have a lot of tenants/clusters to monitor it can work pretty well. On the contrary, be prepared to scale up VMs / storage as the metrics increase.
A better solution would be to include Thanos in the central observability cluster, in particular the receiver component, so we can leverage the same Prometheus Agent (and its benefits) without changing too much in the tenants clusters. This solution will also allow us to extend the Prometheus file system to an s3 bucket for unlimited retention! But this is something we will talk about in the next post :)
Addendum: Prom Label Proxy
In addition to the solution regarding a multi-tenant Grafana, the issue is that you cannot enforce a specific label at datasource level. For this reason, project like prom-label-proxy were created. It sits between your Grafana instance and Prometheus and can enforce a specific label to be passed down to Prometheus. As the name implies: it’s a proxy. For example:
prom-label-proxy \
   -label tenant \
   -value my-tenant \
   -upstream http://my-prometheus-instance:9090 \
   -insecure-listen-address 127.0.0.1:8080
in this way the proxy will add, to each Prometheus query, the label “tenant” equal to “my-tenant” and forwards the request to the prometheus instance. Let’s try to configure the proxy!
apiVersion: apps/v1
kind: Deployment
metadata:
  labels:
    app: prom-label-proxy
  name: prom-label-proxy
  namespace: monitoring
spec:
  replicas: 1
  selector:
    matchLabels:
      app: prom-label-proxy
  template:
    metadata:
      labels:
        app: prom-label-proxy
    spec:
      automountServiceAccountToken: false
      containers:
      - name: prom-label-proxy
        image: quay.io/prometheuscommunity/prom-label-proxy:v0.5.0
        ports:
          - name: http
            containerPort: 8080
        args:
            - "--insecure-listen-address=0.0.0.0:8080"
            - "--upstream=http://prometheus-k8s.monitoring.svc:9090/"
            - "--label=tenant" # here
        resources:
          limits:
            cpu: 100m
            memory: 250Mi
          requests:
            cpu: 10m
            memory: 190Mi
        securityContext:
          allowPrivilegeEscalation: false
          capabilities:
            drop:
            - ALL
          readOnlyRootFilesystem: true
          runAsUser: 65534
---
apiVersion: v1
kind: Service
metadata:
  name: prom-label-proxy
  namespace: monitoring
spec:
  selector:
    app: prom-label-proxy
  ports:
  - port: 8080
    targetPort: http
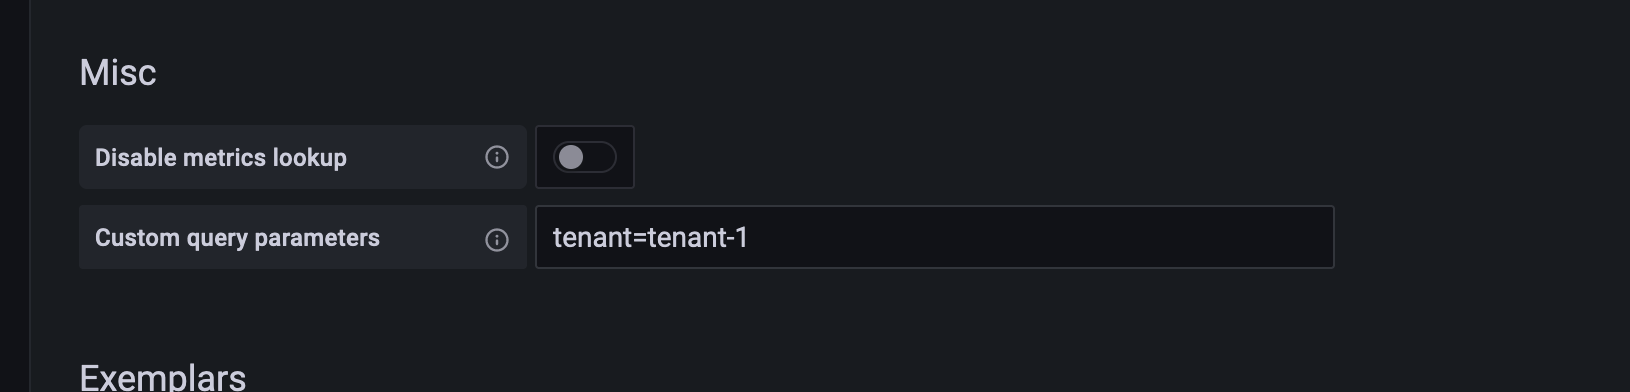
then apply the yaml above. We’re specifing that each request will be forwarded to Prometheus with a query param “tenant” and its value will be defined from the Datasource.
Once the proxy is up and running we can head to Grafana and configure our Datasource for “tenant-1”.
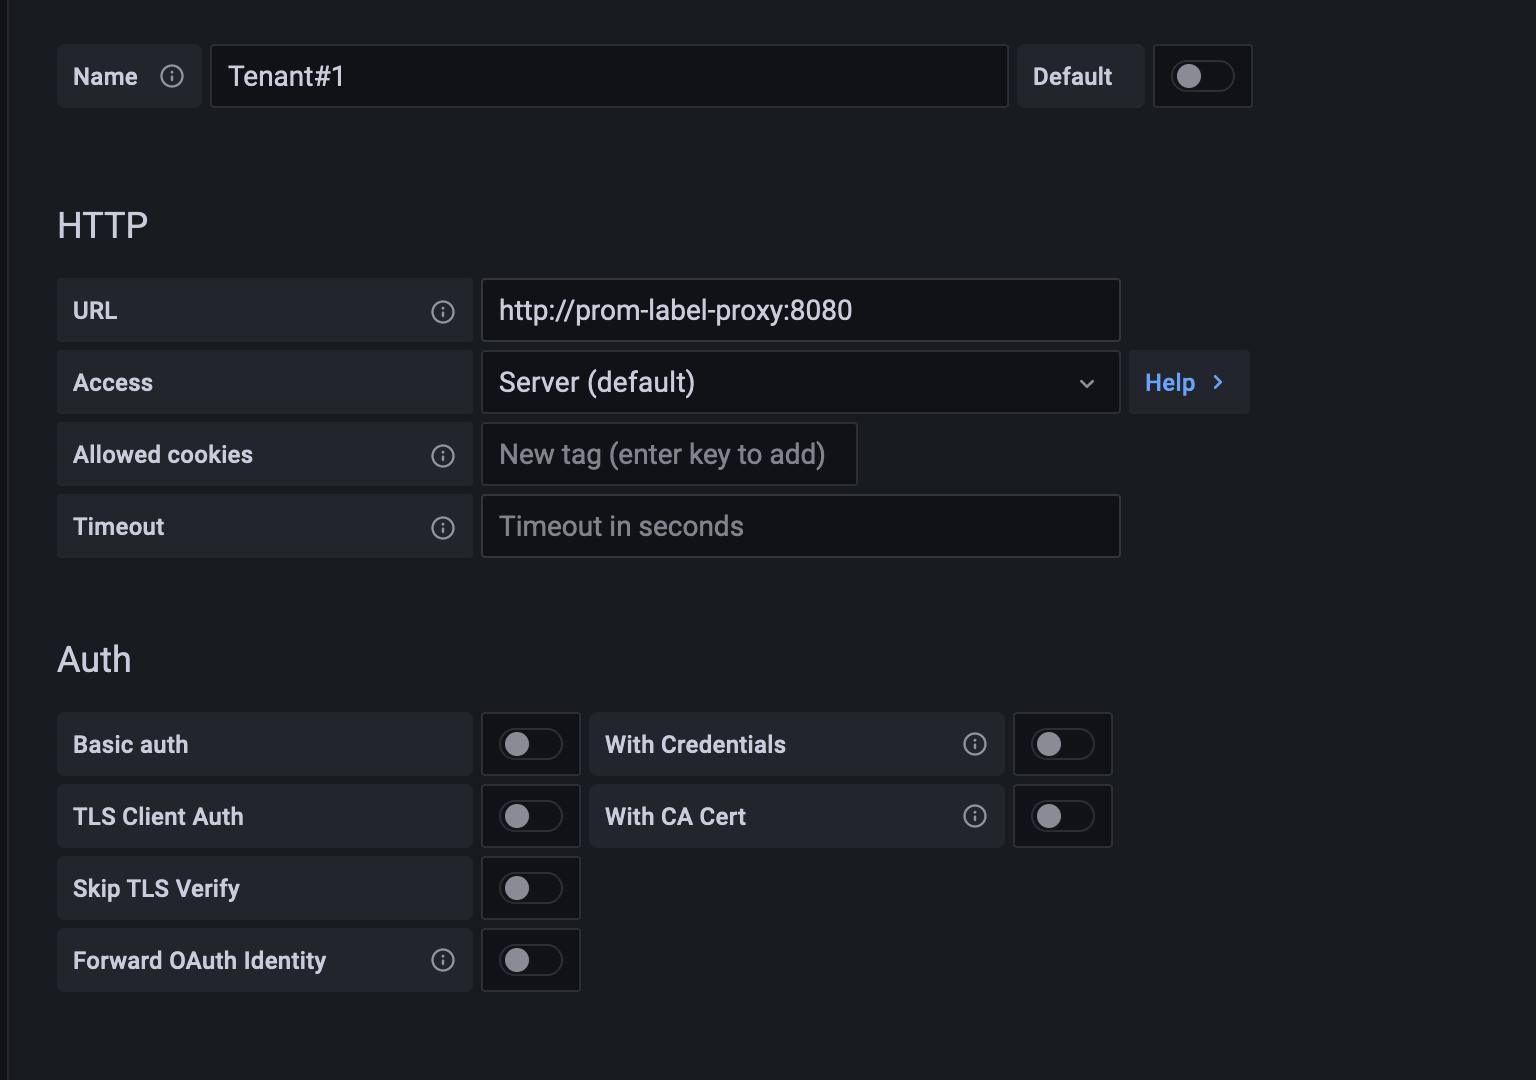
Then we will use this Datasource for our tenant “tenant-1”, achieving the segregation we were talking about before. With this proxy you don’t have to modify your dashboards, just modify the default Datasource for each tenant to the corrisponding one: